A crosstab chart is somewhat more complicated than a single variable chart.
Make your diagrams in the app Crosstab analysis.
When reading a crosstab, you can take either one or the other variable as a starting point.
Each of them fits a diagram.
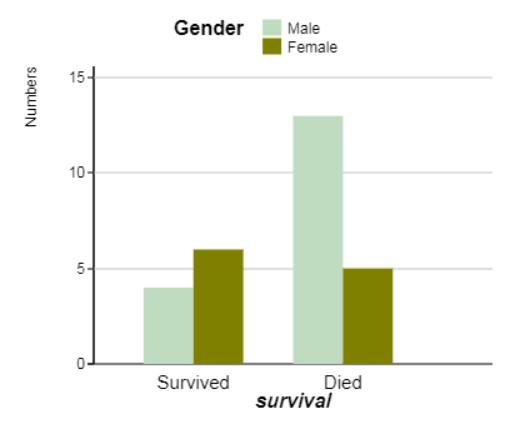
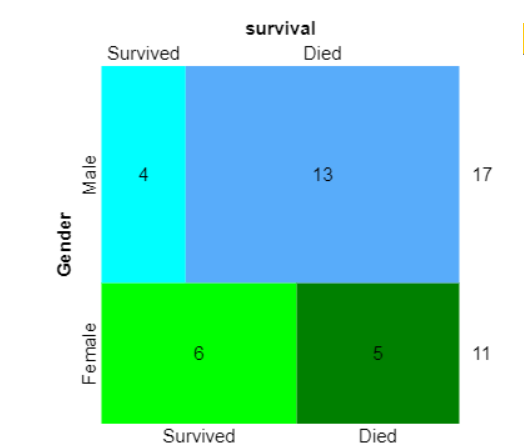
There are two types of charts, with bars or with surfaces in a so-called mosaic plot.
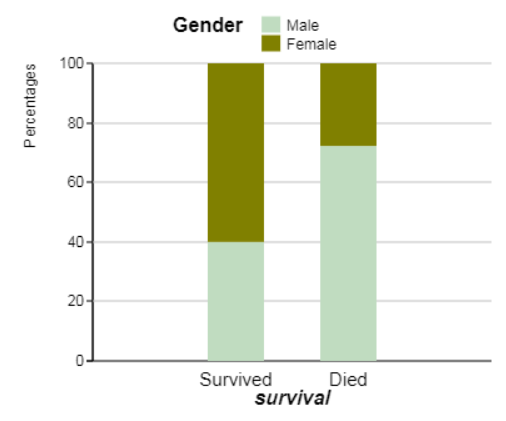
The bars can be absolute or relative, side by side, or stacked.
The mosaic plot you can align to the desired variable.
![]()
A table is already prepared.